
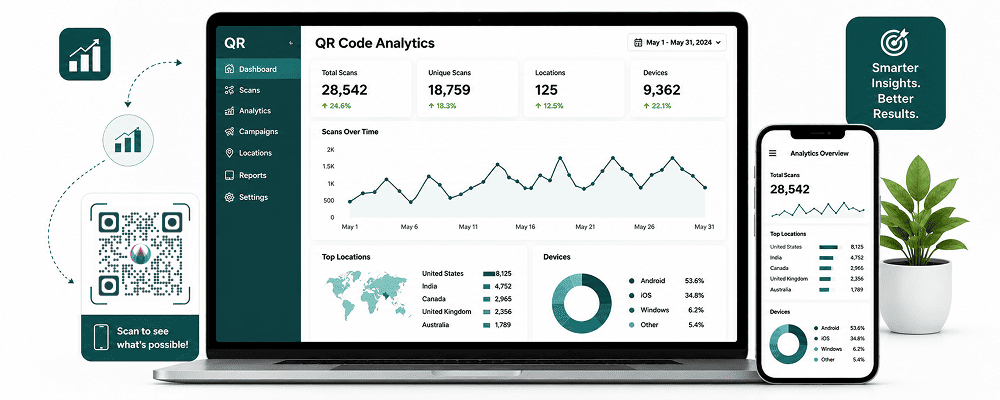
QR codes have evolved from simple tools for sharing information into powerful marketing assets that help businesses understand customer behavior and optimize campaigns. While static QR codes simply direct users to content, dynamic QR codes with analytics provide valuable insights into how, when, and where customers engage with your campaigns.
For businesses investing in marketing, customer engagement, events, product packaging, or digital experiences, understanding QR code performance is essential. Analytics allow you to measure success, identify opportunities for improvement, and make data-driven decisions.
In this complete guide, you’ll learn everything about QR code analytics, including what it is, how it works, the metrics you can track, and how businesses use analytics to improve results.
What Is QR Code Analytics?
QR code analytics refers to the collection and analysis of data generated when users scan a QR code.
Instead of simply directing users to a destination, dynamic QR codes record information about each scan, helping businesses understand:
- How many people scanned the QR code
- When scans occurred
- Where scans happened
- Which devices were used
- Which campaigns perform best
This information allows businesses to measure engagement and optimize future marketing efforts.
Why QR Code Analytics Matters
Without analytics, businesses often operate blindly.
For example:
A restaurant places QR codes on tables, flyers, and advertisements.
Customers scan the codes, but management has no idea:
- Which QR code generates the most engagement
- Which location performs best
- Which campaign drives the most traffic
Analytics solve this problem by providing actionable insights.
Benefits include:
- Better marketing decisions
- Improved customer understanding
- Increased ROI
- More effective campaigns
- Smarter resource allocation
How QR Code Analytics Works
Analytics are primarily available through Dynamic QR Codes.
Here’s how the process works:
Step 1: Create a Dynamic QR Code
The QR code points to a short tracking URL.
Step 2: User Scans the QR Code
When someone scans the code, the scan is recorded.
Step 3: Analytics Platform Collects Data
The system records scan information.
Step 4: User Is Redirected
The user arrives at the intended destination.
Step 5: Reports Are Generated
Business owners can access detailed analytics dashboards.
Static vs Dynamic QR Codes
Static QR Codes
Static QR codes:
- Cannot be edited
- Do not provide analytics
- Store information directly inside the code
Best for simple use cases.
Dynamic QR Codes
Dynamic QR codes:
- Can be edited anytime
- Provide scan analytics
- Track user engagement
- Support marketing optimization
For businesses, dynamic QR codes are typically the better option.
Key Metrics You Can Track
1. Total Number of Scans
This is the most basic analytics metric.
It shows:
- Overall campaign engagement
- Popularity of QR code content
- Campaign effectiveness
A growing scan count generally indicates successful engagement.
2. Unique Scans
Some users may scan the same QR code multiple times.
Unique scans measure:
- Individual users
- New visitors
- Actual audience reach
This provides a more accurate understanding of campaign performance.
3. Scan Location
Location tracking shows where scans occur.
Examples include:
- Cities
- States
- Countries
Businesses can identify:
- High-performing regions
- New market opportunities
- Geographic trends
This information is particularly valuable for national and international campaigns.
4. Scan Time and Date
Understanding when scans happen helps businesses identify patterns.
Examples:
- Peak engagement hours
- Best performing days
- Seasonal trends
This allows businesses to optimize marketing schedules.
5. Device Information
Analytics can show:
- Android users
- iPhone users
- Tablet users
Understanding device preferences helps businesses improve user experiences.
6. Operating Systems
Businesses can track:
- iOS
- Android
- Windows
- Other platforms
This data helps optimize landing pages and content delivery.
7. Browser Information
Analytics can reveal:
- Chrome
- Safari
- Edge
- Firefox
Understanding browser usage improves compatibility and user experience.
8. Campaign Performance
Businesses often use multiple QR codes.
Analytics help compare:
- Flyer campaigns
- Posters
- Product packaging
- Business cards
- Email marketing
This identifies which channels generate the best results.
How Businesses Use QR Code Analytics
Retail Stores
Retailers place QR codes on:
- Product displays
- Packaging
- Promotional materials
Analytics reveal:
- Most scanned products
- Popular store locations
- Successful promotions
This helps improve inventory and marketing decisions.
Restaurants
Restaurants use QR codes for:
- Menus
- Promotions
- Feedback forms
Analytics help identify:
- Popular menu items
- Peak dining times
- Customer engagement trends
This improves service quality and marketing efforts.
Hotels
Hotels use QR codes for:
- Guest services
- WiFi access
- Room directories
- Feedback collection
Analytics reveal:
- Frequently accessed services
- Guest preferences
- Engagement levels
This improves guest experiences.
Real Estate
Real estate agents place QR codes on:
- Property signs
- Flyers
- Advertisements
Analytics help determine:
- Which properties attract attention
- Which locations perform best
- Buyer interest levels
This helps agents prioritize opportunities.
Events and Conferences
Event organizers use QR codes for:
- Registration
- Ticketing
- Schedules
Analytics provide insights into:
- Attendance rates
- Session popularity
- Visitor engagement
This improves future events.
Improving Marketing Campaigns with QR Code Analytics
Identify High-Performing Campaigns
Not all marketing channels perform equally.
Analytics help determine:
- Which campaigns drive engagement
- Which campaigns underperform
Businesses can focus resources where they produce the best results.
Optimize QR Code Placement
Location matters.
Analytics reveal:
- Which posters receive scans
- Which displays attract attention
- Which placements perform poorly
This helps improve visibility.
Improve Landing Pages
A high scan rate but low conversion rate may indicate problems with the landing page.
Businesses can:
- Improve page design
- Simplify navigation
- Add stronger calls-to-action
Analytics help identify optimization opportunities.
Test Different Strategies
Businesses can perform A/B testing by creating multiple QR codes.
Examples include:
- Different designs
- Different offers
- Different placements
Analytics reveal which strategy works best.
QR Code Analytics for Lead Generation
Many businesses use QR codes to collect leads.
Examples include:
- Contact forms
- Newsletter signups
- Consultation requests
Analytics help measure:
- Lead volume
- Conversion rates
- Campaign effectiveness
This improves lead generation performance.
QR Code Analytics for Customer Engagement
Businesses can measure engagement through:
- Video views
- Menu interactions
- Product information access
- Loyalty program participation
These insights help improve customer experiences.
Common Mistakes Businesses Make
Using Static QR Codes
Many businesses miss valuable data because they use static QR codes.
Dynamic QR codes provide far greater insights.
Not Tracking Campaigns Separately
Using one QR code across multiple channels makes performance analysis difficult.
Create unique QR codes for each campaign.
Ignoring Analytics Reports
Data is only valuable when used.
Regularly review analytics and make improvements.
Poor QR Code Placement
Low scan rates often result from poor visibility.
Place QR codes where customers naturally look.
Best Practices for QR Code Analytics
Use Dynamic QR Codes
Dynamic QR codes provide flexibility and tracking capabilities.
Monitor Analytics Regularly
Review performance weekly or monthly.
Look for trends and opportunities.
Set Clear Goals
Define success metrics before launching campaigns.
Examples:
- Increase website traffic
- Generate leads
- Collect reviews
Optimize Based on Data
Use analytics to make informed decisions.
Successful businesses continuously improve campaigns.
The Future of QR Code Analytics
As technology evolves, QR code analytics will become even more sophisticated.
Future innovations may include:
- AI-powered insights
- Predictive analytics
- Customer segmentation
- Personalized experiences
- Advanced marketing automation
Businesses that embrace analytics today will gain a significant competitive advantage.
Frequently Asked Questions
Can QR codes track users?
QR codes can track scan-related information such as location, device type, and scan time, but they do not automatically collect personal information.
Do static QR codes provide analytics?
No. Analytics are generally available only with dynamic QR codes.
Why are QR code analytics important?
They help businesses measure engagement, improve campaigns, and increase ROI.
Can I track QR code scans in different locations?
Yes. Dynamic QR codes can provide geographic scan data.
Which businesses benefit from QR code analytics?
Retail stores, restaurants, hotels, healthcare providers, real estate agencies, event organizers, and many other businesses.
Conclusion
QR code analytics transform simple QR codes into powerful business intelligence tools. By tracking scans, locations, devices, engagement patterns, and campaign performance, businesses gain valuable insights that help improve marketing efforts and customer experiences.
Whether you’re running a restaurant, retail store, hotel, event, or marketing campaign, QR code analytics provide the data needed to make smarter decisions and maximize results.
Track QR Code Performance with DigitalQR
With DigitalQR, you can create dynamic QR codes, monitor scan analytics, track engagement, and optimize campaigns from one powerful dashboard.
Start using QR code analytics today and turn every scan into actionable business insights.